How Satellite Imagery can help farmers save money and improve their fertilizing strategies?
Fertilizer price is skyrocketing following the price of natural gas in Europe. A year ago, liquid nitrogen fertilizer was worth less than 200 euros per tonne; in October 2021, its price was about 800 euros. This soaring gas price also pushes the fertilizer manufacturer to produce less to keep pace with their lower production cost. For example, Yara has cut its ammonia production by 40%.
Farmers are worried and wondering if they will be able to fertilize their fields in spring 2022. It’s less likely that the Nitrogen price will be in a comfortable range before spring. Still, this situation probably offers an excellent opportunity for the farmer to try out to optimize the fertilizer rate without compromising the yield. How to do it?
Fertilization optimization to reduce farmer’s input costs and ensure a healthy environment
The rate and timing of fertilization can be adjusted to decrease nutrient leaching and boost fertilization efficiency. Furthermore, following the 4R principle, fertilization application may be further improved by selecting the appropriate fertilizer type at different crop growth stages.
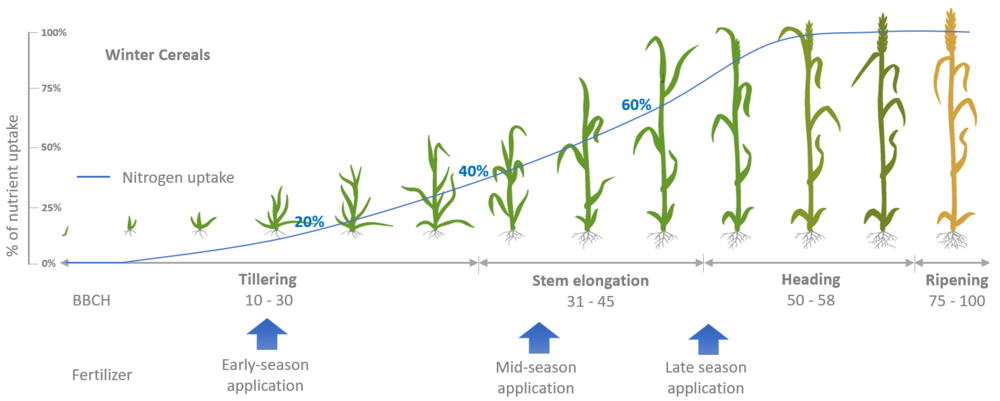
Figure 1: The early-stage N application aids the plants' recovery from the winter dormancy and increases their capacity to produce additional tillers, potentially increasing yield. Plants require more nitrogen during stem elongation in order to create bigger leaves and develop faster. The Mid-season application generally takes care of this. Finally, for greater grain size and higher protein content, a late-season application is required. Split N treatment may not result in a considerable boost in yield, but it does help to reduce lodging and nitrogen loss..
Nitrogen uptake and dry matter map based on satellite imagery to derive in-season nitrogen recommendation map: We can get information on plant dry matter (t/ha) from satellite imagery, which tells us about plant development and helps us predict the crop's Nitrogen need for optimal growth. Additionally, the Nitrogen uptake maps show how much nitrogen the plants have already absorbed from fertilizers, mineralization, and other sources. We can produce a Nitrogen Shortage map by combining these two maps, which simply indicates the current difference to an optimal supply of nitrogen in kg/ha. This map can be used as a fertilizer application map (can also be termed a fertilization recommendation map).
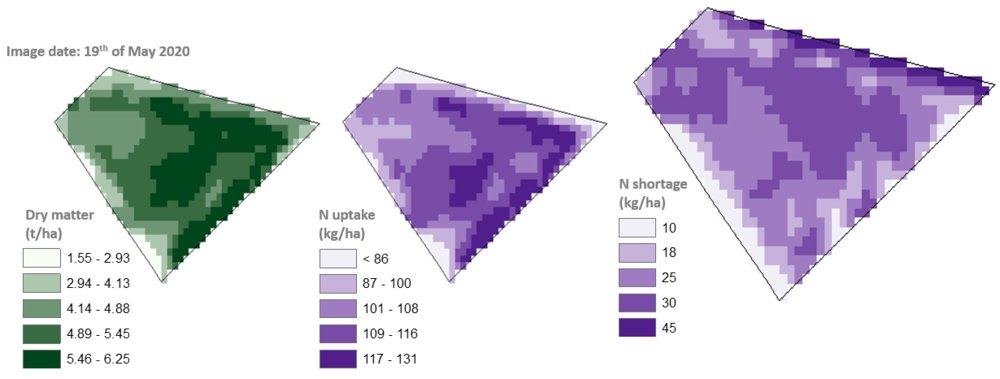
Figure 2: In this example, the plants experienced a deficiency of 25 N kg/ha n mid-May just before the third fertilization, also known as quality fertilization. In contrast, the absorption was 110 kg/ha with a 5.1 t/ha dry matter.
Pre-emergence or early-stage fertilization application map: Different crop growth stages require optimal fertilization planning and successful plant nutrition supply. For example, it is not appropriate to create an N deficiency map that can be used as a fertilizer application map when the plants are in their early stages of development. Furthermore, in some areas, the farmer applies fertilizer at the pre-emergence stage. We propose utilizing our soil productivity map to address the early stage or pre-emergence fertilization map, which simply tells where the productivity of the soil is in the different parts of the field. The underlying idea here is that good soil would produce greater biomass, which will result in a higher nutrient need. So, we recommend applying more fertilizer in the good part of the soil and vice versa.
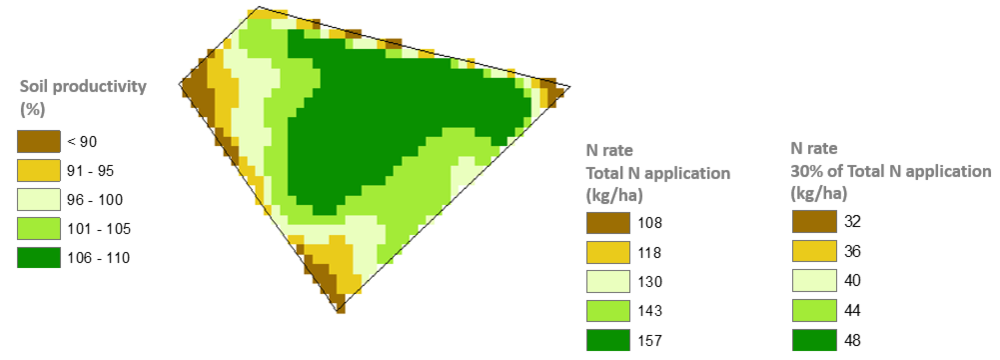
Figure 3: The soil productivity potential is given in percentages in the legend on the left. We can spread the entire amount of fertilizer at once (not suggested) using this map, as shown in the legend in the middle. Finally, the right-hand legend demonstrates how to distribute 42 kg/ha (30% of total base N recommendation) based on soil productivity potential.
Field-specific base fertilization rate recommendation at the beginning of the growing season: We now know how to distribute fertilizer based on soil productivity effectively, but how do we determine the appropriate rate? We can use historical satellite images to our advantage here. We may determine the average (crop-specific) total Nitrogen uptake for a given field in the historical years and use that number as a base fertilizer rate recommendation for the crop the farmers are planning to grow in the upcoming season. The farmer may then determine how much of the total fertilizer to use in the first application.
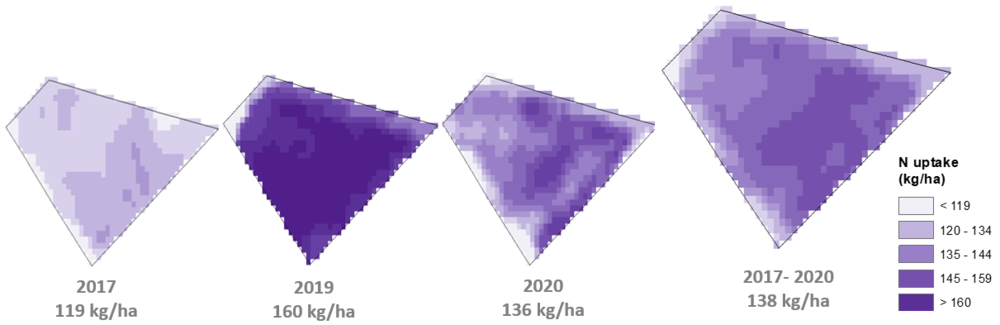
Figure 4: Winter wheat was planted in the specified field in 2017, 2019, and 2020 and the average nitrogen uptake was 138 kg/ha during the previous years. The overall nitrogen uptake in different parts of the field varies greatly from year to year. This is primarily due to the varied weather conditions in different years and the field's soil productivity variability. As can be seen, the total nitrogen intake in 2019 was 160 kg/ha, compared to 119 kg/ha in 2017. And we may say that 2020 was an average year based on the historical average.
Winter wheat fertilization application example of German Farmers: For winter wheat, German farmers, for example, fertilize their fields usually three times. The first application is due in late February or early March, while the second application is from early April to mid-April. The final application deadline is in May. We usually recommend using 30% of the total fertilizer quantity for the first application. So, if the base guideline is 138 kg/ha, farmers can use the soil productivity map to spread 42 N kg/ha. The farmer can utilize the N shortage map for the second and third applications. This split application will guarantee that the plants receive the nutrients they require for optimal development while also ensuring a higher nitrogen usage efficiency, reducing nitrogen loss into the environment.
Cover crop nitrogen credit that can be deducted from the base fertilization rate: The crops usually do not completely absorb the applied fertilizer during the growing season. As a result, there are always some nutrients in the soil that might be washed away by rains or leached into the groundwater. We can reduce nutrient loss by planting cover crops in between growing seasons. The concept is that the cover crop captures nutrients that might otherwise be leached and keeps them inside the plants. The cover crop can be terminated before planting the following crop, and it will function as green manure in the early stages of plant growth. However, how can we know how much nutrition we have mined using cover crops that may be subtracted from the recommended base fertilization rate? The solution is simple: we calculate the total nitrogen uptake by the cover crops just before they were terminated, which may then be subtracted from the basic fertilizer prescription if the farmer uses crop cropping.
Conclusion: According to our country-scale research in Germany, France, and the United States, we have found that the farmers are over-fertilizing their fields by 10% - 30%, indicating that the overall quantity of nitrogen fertilizer used in those nations may be reduced. We didn't know how to improve fertilizer use at scale and cost until now since conventional solutions need soil testing, plant testing, or surveying the fields with portable sensors, which are either too expensive or time demanding. However, employing such satellite-based nitrogen uptake measurement techniques can ensure that fertilization application decisions are data-driven and further optimize the fertilization applications without compromising production and maintaining a healthy ecosystem.
To know more you can visit our Precision Farming page.