The adoption of satellite imagery in precision farming.
Satellite imagery-based maps must be intuitive and actionable – a case study on precision nitrogen fertilization.
The experts believe that the farmers must adopt precision farming by exploiting cost-effective, easy-to-use, satellite imagery-based agricultural application maps, but the adoption of precision recommendation maps in farming is not as high as the industry anticipates. To address this adoption challenge, the industry must offer maps to the farming operations, which are intuitive and actionable. What does that actually mean?
Commonly used analogy, which helps to understand the problem: Let’s say a blood test report says that the patient’s blood sugar level is 200 mg/dL. An average patient probably would not understand much from that report. Now, let’s assume that the report also says that a blood sugar level less than 140 mg/dL is normal. With this new information, the report makes a bit more sense and the patient now can understand that his or her blood sugar level is higher than average. But, to prescribe an effective solution, additional questions must be answered like what the patient’s state was when the (e.g., during fasting) blood sample was taken, what is the blood sugar level after a meal, patient’s age, sex, etc.
This is also true for agricultural recommendation services. So, the industry must offer measurable plant health information along with the benchmark information so that the farmers can understand the status and the needs of their crops better and can take individualized actions for each of their fields.
A case study on precision nitrogen application - intuitive and actionable information is needed: The goal of the study was to find out – can and how satellite-based information impacts farmer’s precision farming decisions. To find out, we have provided two sets of maps to two groups of farmers. Both map sets provide information on the plant’s health that can be utilized to make better and faster N fertilization decisions.
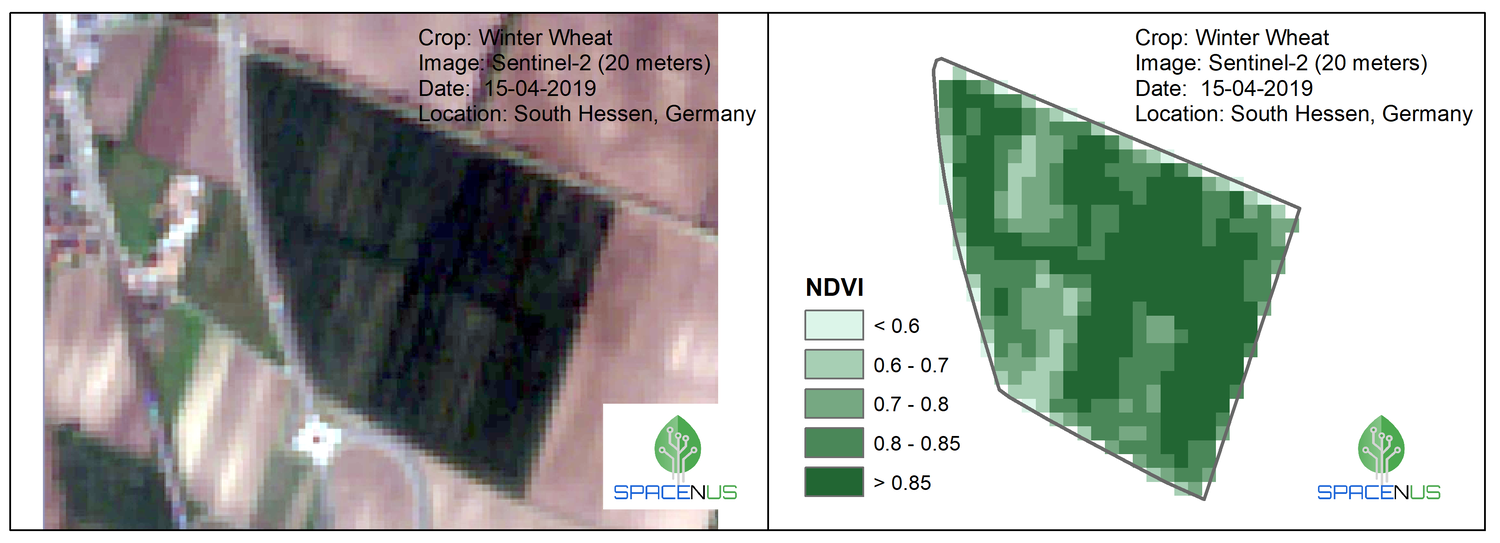
Group A: The first group of farmers has received NDVI maps (Normalized difference vegetation index) to perform Variable Rate (VR) nitrogen fertilization application in their fields (see figure below). The NDVI is a dimensionless index that shows the density of greenness (crop health) on an area of land. NDVI values for plants range between 0 to 1, where 1 represents high and healthy biomass and 0 means dead and low biomass. We also have explained to the farmers, how to best utilize the NDVI maps to spread the fertilizer better – to vary the fertilizer rates according to the variability of the NDVI values in the fields.
From the farmers, we have learned about two strategies for VR N fertilization by using NDVI maps.
1) The plants with high NDVI values should receive the high N rate and the plants with low NDVI should receive less N fertilizer. Here, the underlying assumption is that the field areas with poor plant health / low density / low biomass (meaning lower NDVI) have less demand for N fertilizer.
2) The plants with a low NDVI value should receive a high N fertilizer rate because the low NDVI value may represent the plant nutrient deficiency and lower photosynthesis, thus the plants need more N fertilizer to catch up with the healthier plants.
Both strategies make sense, but which strategy is more appropriate and under which condition? The discussion continued and the ambiguity is still there and at the end, there are two groups of farmers who support two different strategies. The takeaway message from that discussion is that there was no consensus, and probably such ambiguity is limiting the majority of the farmers (the average farmers) from adopting NDVI for the VR N fertilization map. There are ways to resolve such ambiguity by conducting soil test and plant analysis to find out which strategy is appropriate for which field (or part of the field), but that makes the NDVI map utilization process for VR N fertilizer application, time-intensive and cost-inefficient.
So, the conclusion is – NDVI is simple to read and good for field scouting but offers complex information, which is hard to interpret thus makes it less actionable in terms of N fertilizer application because NDVI represents combined information on biomass and stresses.
Group B: The second group of farmers was provided with two maps, initially (see the figure below). One showing the dry matter (DM) distribution in the t/ha unit and another one showing the nitrogen uptake in kg/ha. The idea was to show them the plant growth (biomass accumulation) and N uptake, separately. We quickly realized that the N-uptake map is much more intuitive because the farmers’ cloud relates to that and engage in productive discussions like “I usually provide 170 N kg/ha to grow my winter wheat crop (2/3 split N applications) and the map shows that the plants have taken up 70 kg/ha N, which means the plant still needs some 100 kg/ha N that needs to be distributed over the next two fertilization applications” (see the figure below). While the group A farmers had struggled to decide the N rate in relation to the dimensionless NDVI index values.

Moreover, it was also interesting to observe that the DM and N uptake distribution are not the same and that raised the question of why not the same? The explanation is that the higher DM does not necessarily mean that the N uptake will be higher and that may be due to a variable supply of N by the soil or variability in the plant’s ability to take up N due to some other limiting factors like water availability or total biomass accumulation. Here the VR fertilization strategy is – areas with high DM + high N uptake need less fertilizer but the areas with high DM + low N uptake need more fertilizer. This strategy was convincing and there was a consensus. Now the question is how to determine the fertilization rate, precisely?
To address that, as a next step, we have presented the farmers with two more maps (see the figure below). One showing the current total N demand (N critical, represents the benchmark information) of the plants for optimal growth, which is derived from the dry matter map. And another map is showing the difference between the N demand and N uptake, which we call the N shortage map. The N shortage map represents the amount of N the plant still needs to grow optimally, and this map can be used as a basis for VR fertilization application.

For this field, the NDVI map and DM map are somewhat correlated, but this might not be true for other fields. Now, if we notice the NDVI map and the N shortage map, we can observe that there is not much correlation between the two maps. So, applying N fertilizer based on the NDVI map might not be optimal in every case. Moreover, the N shortage map provides measurable information thus makes it actionable. However, we have recommended on an average 42 kg/ha N rate for this field, but the farmer had decided to apply 60 kg/ha N. Without our information the farmer would have applied 80 kg/ha. By using this map, the farmers have cut 20 kg/ha N – meaning additional revenue for his farm.
So, the crop DM and N uptake maps, along with the benchmark (N critical) information, offer a comprehensive overview to the farmers that helps them to understand and assess the N fertilization need better and makes the N shortage map much more actionable.
If you are interested to know more about this or how we do it, you can visit our Precision Farming page.
Conclusion: If you stand still for a moment and carefully think, I believe you will agree with us that our farmers are brave in adopting new technologies. They care about the environment and understand the very concept of sustainability. Because Farming is a business of sustainability, which is usually carried out over generations. So eventually the farmers will adopt the precision farming techniques in every field of our planet, and we can ensure faster adoption by providing them intuitive and actionable information, therefore, assist them in growing our everyday food.