
SatMRV - Independent SOC MRV & Practice Verification
Registry-compliant soil carbon MRV from a verifier with nothing to gain from the result.
SatMRV is Spacenus soil carbon monitoring, reporting and verification for carbon programmes and supply chain operators. It delivers a high-resolution soil organic carbon baseline per field, three to five year RothC trajectory projections under alternative practice scenarios, satellite-guided stratified sampling designs, and an assurance-grade Digital Proof of Practice certificate per field. Outputs are formatted for Verra VM0042, EU CRCF, GHG Protocol and Gold Standard, with quantified uncertainty and pre-filled assurance annexes. Spacenus supplies the evidence; accredited bodies remain the verifiers of record.
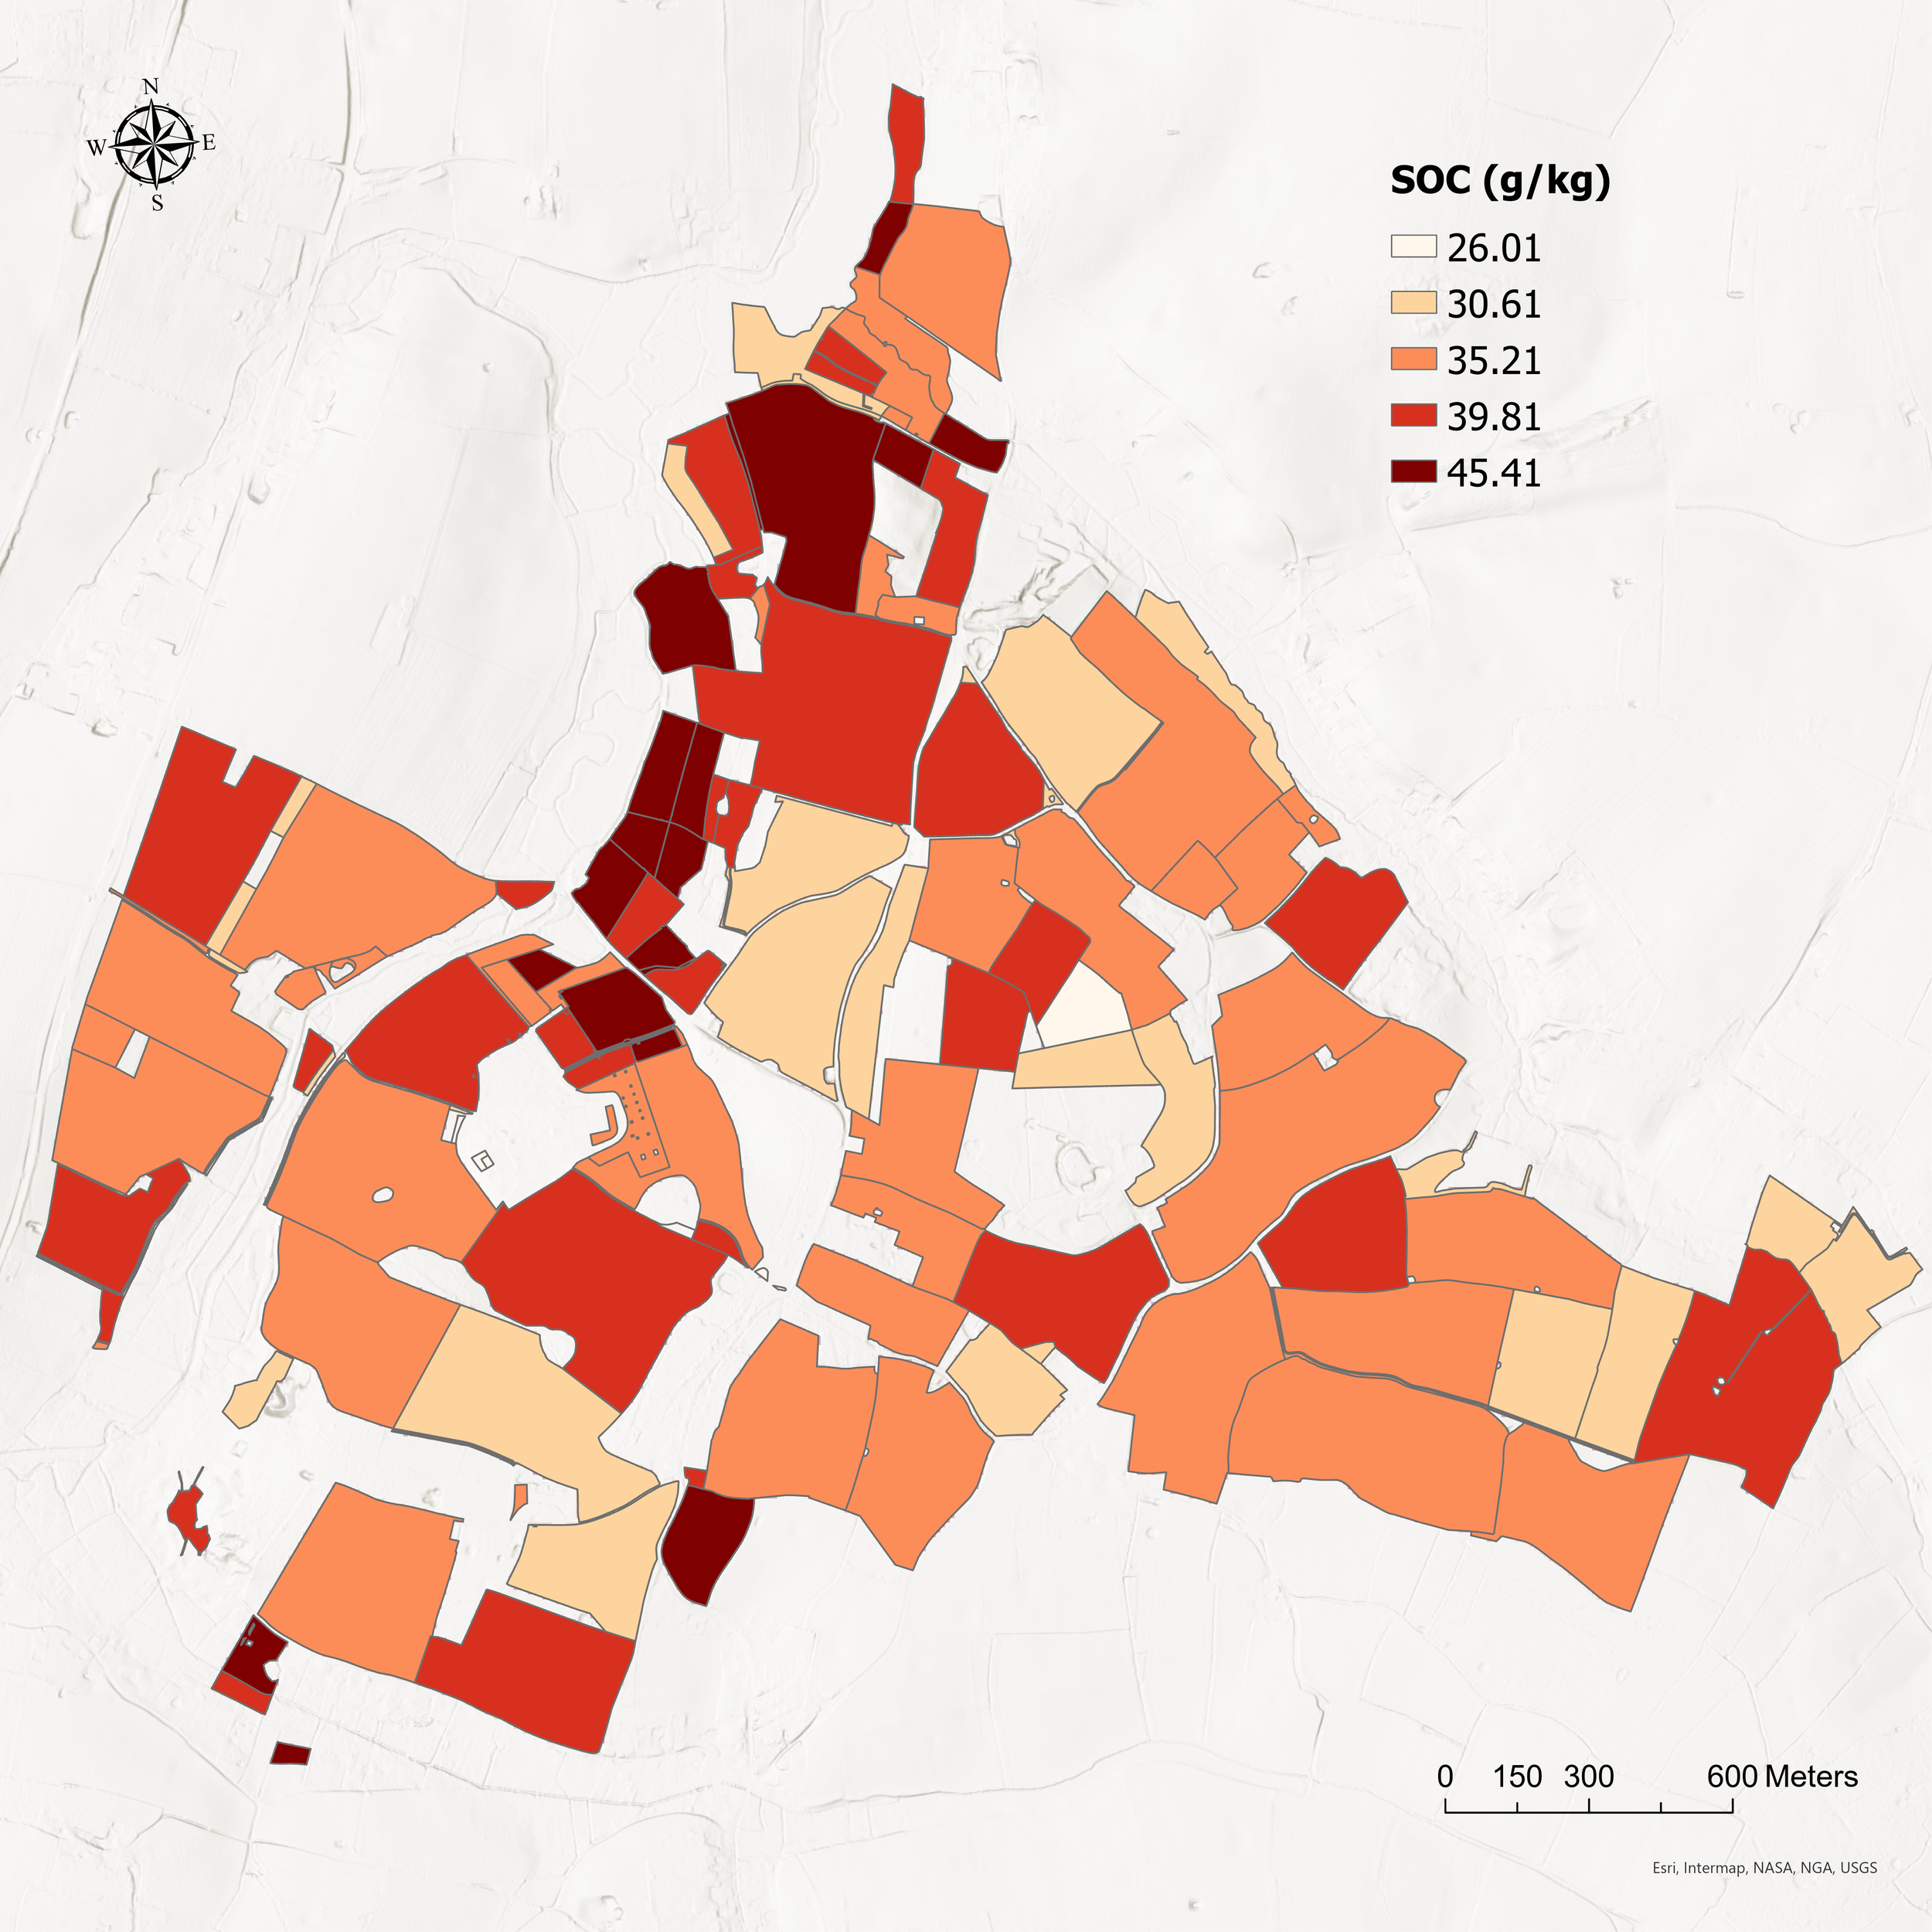
SOC Baseline: 61.4 t C/ha
Trajectory +5.3 t/ha (5yr)
Nr. of Samples: 70 (vs 210 std)
Processing (parallel) time: 2:47 min
Field area: 1050.4 ha
Standard: VM0042 · CRCF · GHG LSR ✓
WHAT SATMRV DELIVERS
Everything your SOC programme needs. Nothing more.
| Output / Service | Description |
|---|---|
| SOC Baseline Maps | High-resolution soil organic carbon baseline per field, processed from Sentinel-2 time-series combined with RothC modelling. Deliverable: PDF + API output. |
| Stratified Sampling Plans | Satellite-optimised soil sampling design that reduces physical sample count by up to 50% (1 sample per 16 ha vs standard 1 per 5 - 7 ha) while maintaining statistical validity. |
| Chain of Custody (CoC) | In-field sampling guidance: field teams navigated to each sampling point in the app, laboratory results uploaded back into the same record, unbroken from sampling point to certificate. |
| RothC Trajectory Modelling | 3–5 year SOC trajectory projections under different practice scenarios. Enables carbon programme operators to financially plan future credit volumes before committing to programme design. |
| Digital Proof of Practice (DPP) | Four-stream TVM triangulation: plausibility pre-screening + Sentinel-2 satellite time-series + verified geotagged photos + spatial cross-validation. Output: cryptographically signed DPP certificate, audit-ready, registry-compatible, CSRD-traceable. |
| Registry-Ready Audit Reports | Formatted PDF and API outputs for Verra VM0042, EU CRCF, GHG Protocol, and Gold Standard. Uncertainty quantification documented for CSRD limited assurance requirements. Registry validation itself is performed by accredited third-party auditors and validation/verification bodies (VVBs); Spacenus supplies the independent MRV evidence and outputs they validate. Evidence packs include pre-filled assurance annexes (ISO 14064-3 / ISSA 5000-aligned), sampling frames and QA/QC logs, built to withstand oversight review of the verifier itself, and to cut your VVB’s unbillable preparation time. |
| Biodiversity & Water Modules | Optional ESRS E3 (water/evapotranspiration) and ESRS E4 (biodiversity habitat mapping) add-on modules for programmes requiring full multi-dimensional CSRD coverage. |
PROGRAMME ECONOMICS
Why programme economics only work with satellite-native MRV.
Traditional MRV approaches consume 25–50% of carbon project budgets - making most programmes financially unviable at scale. SatMRV fundamentally changes the economics - reducing MRV cost to under 5% of credit revenue per hectare.
<5%
MRV cost as % of credit revenue per ha
67%
pilot-to-programme conversion rate
<1 min
Processing time per 100 ha SOC baseline
50%
Soil sampling density reductions
Structural independence is not a marketing claim.
It is a legal requirement.
STRUCTURAL INDEPENDENCE
EU CRCF requires that carbon farming verification be conducted by an independent party, not by the entity that designed or operates the programme.
Integrated programme operators - those that recruit farmers, issue credits, and verify outcomes, face a structural conflict of interest the regulation was designed to address. Spacenus does not operate any programme. We verify programmes run by others.
Spacenus has no credits to sell. No programmes to defend. No financial stake in whether a practice change occurred. This is not a positioning choice, it is a structural fact codified in how the company operates.
For every buyer, independence means something specific:
The DPP certificate is the document that de-risks your registry submission and supply chain disclosure - precisely because it comes from a party with nothing to gain from the outcome.
Spacenus does not replace accredited verification and validation bodies - it equips them. Evidence packs are engineered to pass VB file review and oversight audit, with reproducible methods and a ten-year logged trail. VBs remain the verifiers of record; SatMRV cuts their cost and turnaround per farm.
WHO USES SATMRV
Trusted across the agricultural sustainability value chain.
Carbon Project Developers
MRV at under 5% of credit revenue, compared to 25–50% for conventional approaches. Scale to large hectarage without proportional cost increase. Reduce farmer sampling burden.
Food Companies & Retailers
CSRD ESRS E1 Scope 3 Category 11 primary data. SOC baseline and trajectory forecasting for SBTi FLAG target-setting. Evidence for carbon insetting claims.
Standard Bodies & Auditors
Recognised Standards deploy Spacenus triangulation methodology globally. Target applications include global sustainability certification schemes across agriculture and natural fibre supply chains.
Request a SatMRV pilot on your real data.
6–8 weeks. Your fields, your standard. You see actual SOC maps and DPP certificates before any long-term commitment.
-
Sample count follows from the confidence level and the minimum detectable difference the standard requires, so it is design-specific. Across monitored pilots and projects, satellite-guided stratification has averaged about one sample per 16 hectares against a European standard of roughly one per five. Heterogeneous sites and tighter uncertainty targets require more samples, not fewer.
-
Bulk density and equivalent soil mass require physical measurement and cannot be derived from orbit. Soil organic carbon stock is not directly observable from satellite, fertiliser application is not remotely observable, and model transferability degrades outside the calibration range. Stratification reduces how many physical samples are needed. It does not remove the need for physical measurement.
-
Spacenus supplies the independent MRV evidence. CRCF certification is issued by certification schemes and validated by ISO 17065-accredited bodies, which Spacenus is not and will not become. Because Spacenus operates no programmes and sells no credits, it can supply evidence to an operator who legally cannot self-supply it. Spacenus methodology registration is in preparation.
-
A three-to-five-year projection of soil organic carbon per field under alternative practice scenarios, so a developer can plan credit volumes before committing to a programme design. A baseline states what a field holds; a trajectory states what can be financed against. Projections carry quantified uncertainty, and that uncertainty widens at the five-year horizon.