Nitrogen shortage map
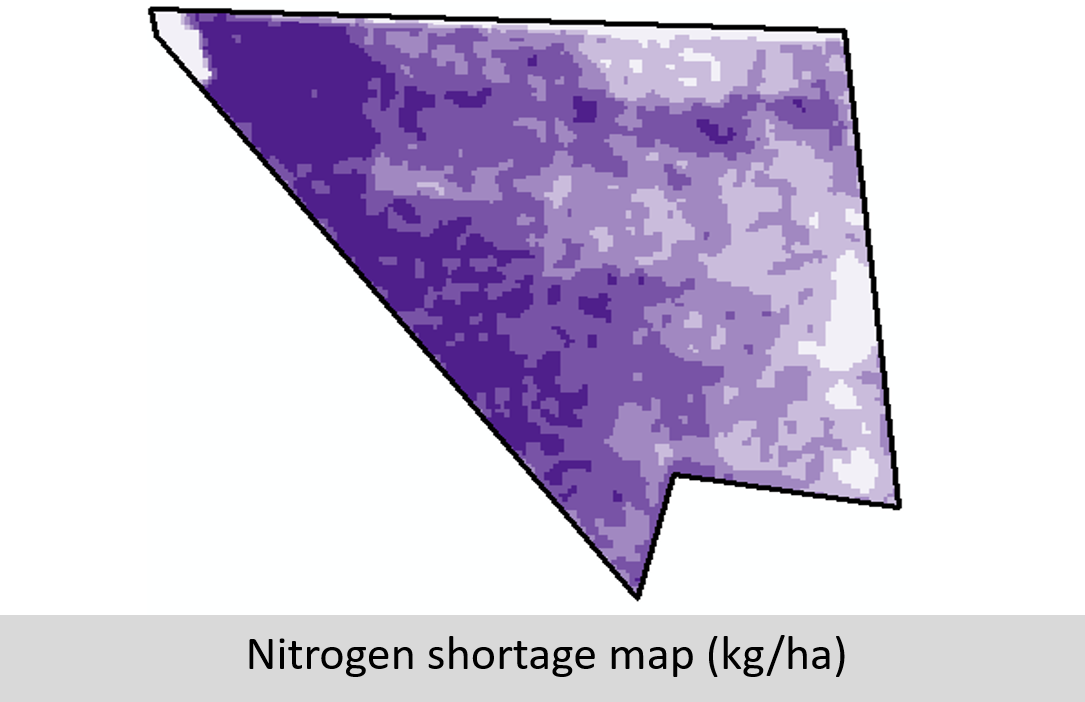
The nitrogen shortage map shows the current difference to an optimal nitrogen supply in kg/ha. When calculating the undersupply, all influencing factors such as mineralization etc. that have had an impact on the field up to the time of the last usable satellite image are taken into account. This map can be used as a basis for fertilizer applications based on plant needs.
Main advantages:
- Decision-making aid for selecting the right amount of fertilizer depending on the plants' needs
- Real-time information at scale and available worldwide
- Nitrogen analysis at a low price as no large initial investment is necessary
- Users have the final say and can change the actual application rates according to their fertilization strategy
- Enables efficient fertilization that leads to optimal yields without polluting the environment - for more sustainable agriculture